Our research interests and expertise cover a wide range of topics at the intersection of transportation engineering, urban planning, network science, and information technology. More specifically, we are interested in big and open urban data visualization and analytics, complex networks in transportation, traffic flow theory and characteristics, pedestrian crowd modeling, travel demand and behavior modeling, and large-scale transportation network modeling and simulation.
Below is a list of our completed/ongoing projects:
Below is a list of our completed/ongoing projects:
FEATURED PROJECTS
|
Large-Scale Dynamic Transportation Network ModelingA simulation-based dynamic traffic assignment (DTA) model is an analysis tool to address complex and dynamic transportation operations and planning issues of urban road networks. It overcomes the limitations of traditional static assignment models by using advanced traffic modeling techniques to capture the dynamics of congestion formation and dissipation associated with time-dependent demand and network conditions. We are interested in development of such models and their applications in road pricing and traffic control.
|
|
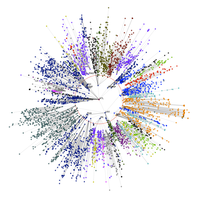
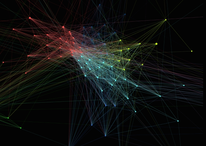
Network Science and Urban TransportationNetwork science is a highly active interdisciplinary research area inspired by numerous empirical studies of computer and social networks. We are interested to study urban transportation systems from a complex network perspective. We are motivated by the recognition that travel demand in cities, consisting of thousands or millions of origin–destination trips, can also be viewed as a network, more precisely a large-scale temporal weighted directed network.
|
|
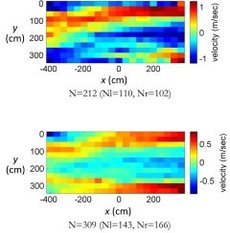
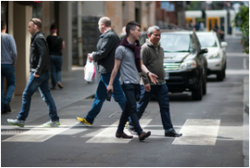
Pedestrian Crowd Modeling and SimulationReliable pedestrian crowd modeling and simulation tools are needed for a better understanding of human crowds behavior and dynamics that govern their movements. We are interested in studying mobility dynamics of pedestrians in complex environments. As an example, we have developed an agent-based simulation model of Richmond train station in Melbourne. The model benefits from a real-time stream of data from a network of wifi detection sensors installed at the station to detect passengers movements.
|
PAST PROJECTS
|
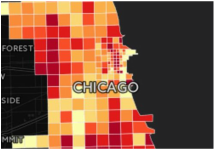
Crime Statistics and Travel BehaviorWhether crime or the perception of it has any direct and significant influence on travelers’ mode choice is a topic for which the evidence remains inconclusive. In this project, we explore these questions through the study of individual travel behavior by using discrete choice models applied to the reported home-based work trips in the Chicago household travel survey. Mode choice was modeled as functions of variables such as socio-demographics, neighborhood crime density (as a safety measure), and walk score (as a measure of walkability).
|
|
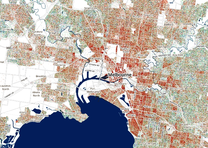
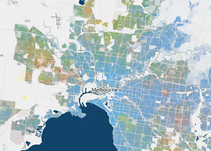
Changing Melbourne 2.0Cities are dynamic, connected, and complex systems that are constantly evolving in many and varied ways. Changing Melbourne 2.0 uses visual analytics to demonstrate how socio-demographic characteristics of Melbourne are changing over time. We have developed a series of dot maps in which each dot is a person counted in the Census.
|
|
Housing and Transport AffordabilityHousing affordability is traditionally measured using the percentage of income spent on housing costs. An important cost that is usually overlooked in measuring affordability is the transport or accessibility costs. This project aims to develop a new model to measure housing and transport affordability in Australia, with greater Melbourne selected as the pilot study area.
|
|
Places by MetroPlaces by Metro is an interactive application reinventing public transport users experience, connecting businesses to travelers across Melbourne. The project demonstrates accessibility to businesses by Metro trains.
|
|
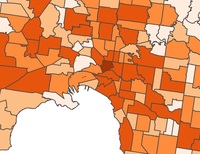
Melbourne Road Safety Portal (Beta Version)Australia has achieved substantial reduction in road crash fatalities over the last 30 years. However, the estimated annual cost of road trauma is still very high at near 18 billion AUD. In this project, we visualize and analyze road crashes data (2010-2012) in Melbourne at the Statistical Area Level 2 (SA2).
|
|
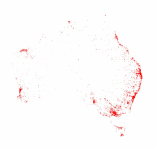
Chinese Population Dot Map of Australia (GovHack 2015)China is Australia's largest two-way trading partner in goods and services valued at more than $160 billion per year. Besides the economic relationship, the two countries are actively engaged culturally. Persons born in China are the third largest group of overseas born residents in Australia as of June 2013. This is a map of every person identified as Chinese counted by the 2011 ABS Census. The map has 866,001 dots - one for each person. Try zooming in to see the incredible details.
|
|
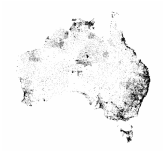
Indigenous Population Dot Map of Australia (GovHack 2015)In 2011, there were 699,900 Indigenous people living in Australia, accounting for 3% of the total Australian population. Understanding the spatial distribution of different population groups is a key element in the socio-economic planning and policy-making process relating to specific population groups. This is a map of every indigenous person counted by the 2011 ABS Census. The map has 699,900 dots - one for each person. Try zooming in to see the incredible details.
|
|
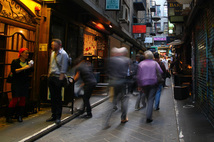
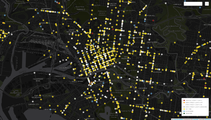
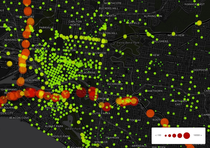
Melbourne Pedestrian Activities and Safety (GovHack 2015)Melbourne is a sleepless city with more than 800,000 people moving around it everyday. This project provides insights into the spatial and temporal distribution of pedestrian activities and crashes in Melbourne. We used 5-years worth of pedestrian count data (2009-2013) from City of Melbourne Open Data Portal containing more than 1.1 million rows combined with 5-years worth of pedestrian crash data (2009-2013) from Victorian Government Data Directory.
|

|
Victoria Connect (Beta Version)Victoria Connect helps Victorian residents make their neighborhood works better by reporting issues such as potholes, damaged signs, signal malfunction, unsafe locations, crashes, near-crashes, debris on the road, dead animal, etc. Reports are collected and archived at a database hosted at Monash University for research purposes.
|
|
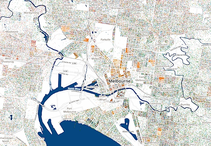
Melbourne Pedestrian Crashes by Light ConditionIn this project, we have mapped 5-years worth of pedestrian crashes in Melbourne, categorized by light condition. Other information including crash severity and speed limit are also included.
|
|
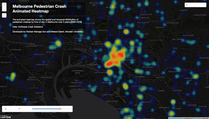
Melbourne Pedestrian Animated Crash HeatmapThe animated heatmap shows the spatial and temporal distribution of pedestrian crashes in Melbourne by time of day over 5 years (2009-2013). The developed visualization can be used as a simple tool to locate pedestrian safety hot spots for further analysis.
|
|
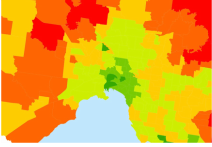
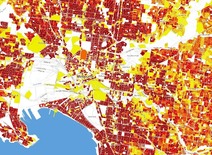
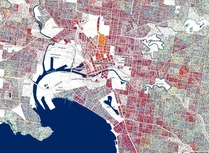
Melbourne Income MapFamily income is an important socio-economic variable that influences travel behavior and demand. In this project, we visualize the spatial distribution of household income in Melbourne in 2011.
|
|
Melbourne Truck Map 2.0Extending Melbourne Truck Map 1.0, in this project we are visualizing the spatial distribution of truck volume ratios (ADTT/AADT). The new map shows a different picture of exposure to truck traffic in Melbourne.
|
|
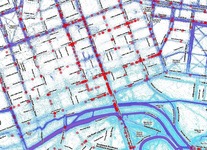
Melbourne Truck Map 1.0The map visualizes the spatial distribution of Average Daily Truck Traffic (ADTT) in Melbourne in 2012. Trucks here include towing vehicles, small trucks, and class 2+ trucks.
|
|
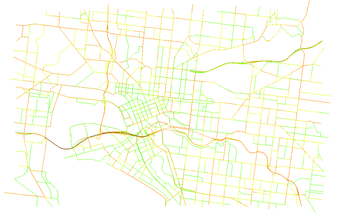
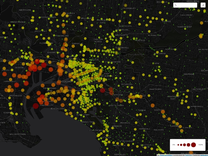
Complex Network of Travel Demand in MelbourneIn 2013, an estimated 14.2 million trips were made on an average weekday in greater Melbourne area. Such large scale demand for travel between origins and destinations can be visualized and analyzed as a complex network.
|
|
Melbourne Car Ownership MapAs of 2013, there were 13 million passenger vehicles registered in Australia. In this project, we visualize the spatial distribution of car ownership by dwelling in Melbourne metropolitan area using Census (2011) data. Every dot in the map represents a dwelling.
|
|
Melbourne Bike Crash MapCycling is growing in Australia. The number of bike trips to work in the Greater Melbourne area has increased from 12,124 in 1991 to 25,572 in 2011. Despite the growing interest in cycling, bike safety has remained a concern. In this project, we visualize 5 years' worth of bicycle crashes from 1/7/2008 to 1/7/2013 with the Strava Global Heatmap as the background layer.
|
|
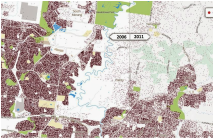
Melbourne Housing DensityMelbourne has more than 1.5 million private dwellings. This project uses household dwelling data at the Mesh Block level from Census 2011 to visualize the spatial distribution of housing density in Melbourne.
|
|
Melbourne Age MapThe Melbourne Age Dot Map visualizes the spatial distribution of population by age in Melbourne. A pattern that stands out most is the concentration of Millennials (20-35 years old) in the CBD and inner city areas. Also, a closer look at the newly developed fringe suburbs reveal that those areas are mostly inhabited by population under 65 years old.
|
|
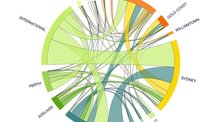
Air Travel in AustraliaIn the year 2013, there were 87 million passengers carried in the Australian airspace, including 56 million domestic passengers and 31 million international passengers. The numbers are even more staggering knowing the population of Australia is only 23 million. In this project, we visualize domestic and international airline activities in Australia.
|
|
Melbourne Ethnicity MapAustralia has one of the most diverse population in the world. In 2011, over one in four of Australia's population were born overseas. This project provides a visualization of spatial distribution of population and ancestry diversity in Melbourne showing the extent in which Melbourne is ethnically mixed or segregated.
|
|
Changing Melbourne 1.0Australian Bureau of Statistics estimated that 4.35 million people lived in Greater Melbourne in 2013. Melbourne's population is projected to increase continuously to between 7.6 and 9.8 million in 2061, becoming the nation's largest city. In this project, we present a series of interactive visualizations showing how demographics of Melbourne have changed over time using Census data.
|