|
A Dynamic traffic assignment (DTA) model can be used to analyse various "what if" scenarios. A DTA model uses advanced traffic modelling techniques complemented with equilibrium-seeking routing strategies to estimate how traffic forms, propagates and dissipates in a network given an origin-destination demand matrix and a range of different scenarios. We can use a DTA model to evaluate the impact of adding or removing a link to/from the network, road use pricing, traveller information, disruption in the network, evacuation, traffic management and control strategies, and so on. DynaMel is the first large-scale mesoscopic simulation-based DTA model of Melbourne. We have deployed DynaMel in the AIMSUN environment and so far have calibrated and validated it for 6 - 10 AM morning peak period. Following is a video demo of DynaMel, showing how congestion forms and spreads throughout the CBD area and gradually recovers towards the end of the peak period.
1 Comment
The concept of road use pricing is not new. Research on the topic started way back in 1920's; Pigou's work on the economics of welfare (1920) and Knight's work on fallacies in the interpretation of social cost (1924). Since then, a wide range of theoretical and practical models have been studied and proposed. Cities like London, Stockholm and Singapore have successfully implemented a form of congestion pricing. In an ongoing research with my PhD students Ziyuan Gu and Sajjad Shafiei, we have developed and evaluated different pricing schemes for Melbourne road network using our state-of-the-art dynamic traffic assignment model of Melbourne (DynaMel) and an in-house developed simulation-based optimization (SBO) framework. Let me know if you are interested in the details of the methodology and I will send you the draft paper. Cordon-based pricing We first test a simple cordon-based pricing scheme with Melbourne CBD selected as the cordon (see the picture below: the inner rectangle is the cordon). A limitation of the cordon toll is that the distance traveled within the cordon is not taken as a determinant. Users are equally charged regardless of their actual usage of the urban road space. The resulting social inequity may create negative public acceptability towards the cordon charge. 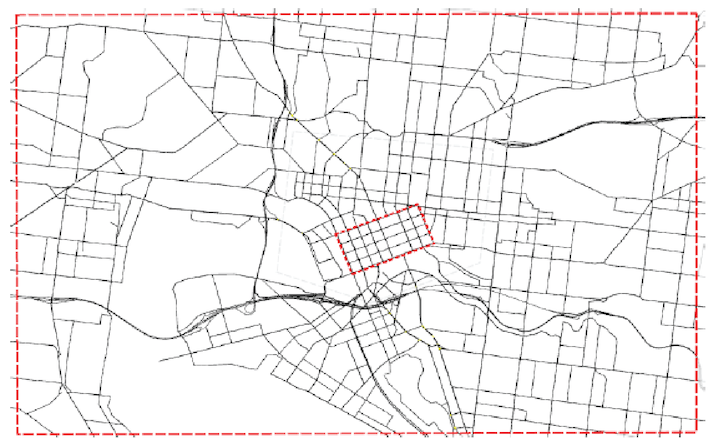 The optimal toll to mitigate congestion in the CBD was found to be $2 per entry to the CBD. This is a not final number though. There are quite a few assumptions and limitations behind it that makes it not ready for real-world implementation yet. Distance-based pricing We then propose a linear distance toll that keeps the congestion of the pricing zone (Melbourne CBD) below a critical value. Users, if entering the CBD, need to pay a toll that is linearly related to their travel distance within the cordon like a pay as you go system. Since users are charged according to their trip lengths within the pricing zone, the distance toll distinguishes, for example, between a user who reaches the destination immediately upon crossing the cordon and a user who traverses the whole pricing zone, thereby creating a more equitable and efficient pricing scheme. The optimal distance-based pricing was found to be $1 per kilometer. Again, this is a not final number given the assumptions and limitations behind the methodology. Joint distance- and time-based pricing We then propose a joint distance and time toll. In a distance only based pricing, users tend to be driven into the shortest paths within the cordon. Although the travel time on these shortest paths increases as a result of a larger traffic volume, the majority of users may not change their routes because the utility from paying a lower distance toll may dominate the disutility from the increase in travel time. Hence the concentration of users into a few shortest paths within the cordon makes the congestion distribution in the city uneven and as a result reduce the network performance. Therefore, a novel solution is to charge users jointly based on the distance traveled and the time spent within the cordon. Under this scheme, users are more likely to distribute themselves into the second or third best shortest path. The optimal joint distance- and time-based pricing was found to be $0.35 per kilometer and $9 per hour. Again, this is a not final number given the many assumptions and limitations behind the methodology. Does congestion pricing work? All three pricing schemes were successful in mitigating congestion in the CBD without actually pushing traffic to the periphery. The Melbourne CBD, here, is selected only as an example area for pricing. We can (and actually should) change the boundary of the pricing area to better capture the existing and future traffic patterns. Given the input demand to the model, the pricing activates a little after 8:30 am and will last until 9:15 am. This could change depending on the time-profile of demand. If congestion (above the critical threshold) starts earlier, let's say 8:00 am, the pricing will also activate earlier. Overall, the results were promising. All three pricing schemes were successful in keeping the congestion level (measured by average network density) below the selected threshold as shown in the following figure (left). As expected, the total distance traveled within the CBD was also reduced. See the right figure. 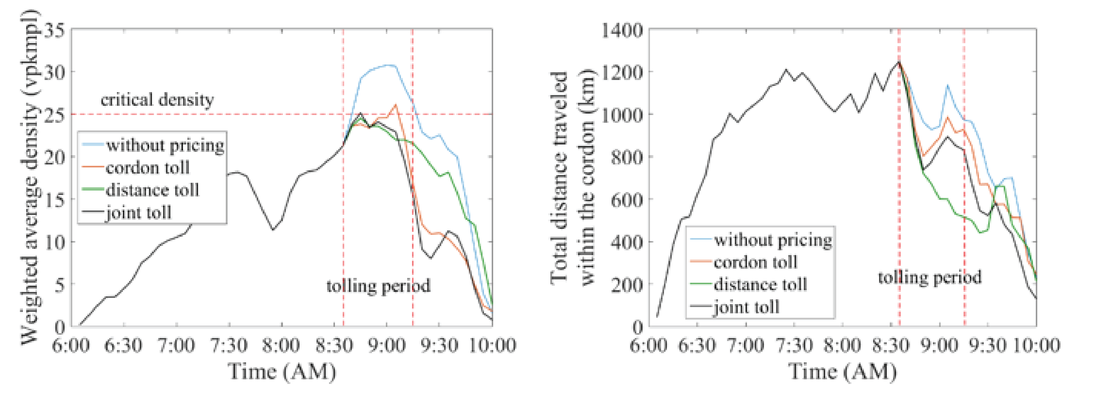 Limitations and assumptions There are quite a few limitations and assumption behind this work though. First, the area for pricing is arbitrarily selected and may not be the best cordon. Second, we assumed an average value of time of $15 per hour with no consideration of heterogeneity or any distribution. Third, the demand is assumed inelastic or fixed. It means that users do not change their departure time or shift to other modes because of pricing. What's next? We are working to relax some of these limitations and assumptions. We are trying to make the demand elastic. So, users can shift to other modes like public transport if they find the congestion toll too high to drive, just like how parking cost in CBD works sometimes. Also, we would like to consider a distribution of value of time and travel time reliability in the model. We welcome collaboration with government and industry partners to further progress this research. We hope our work contributes to the discussion on transport network pricing in Australia, especially in Victoria. The increasing availability of non-traditional data for transportation planning provides enormous opportunities to greatly improve the way we analyze and model transportation patterns and systems in cities. The record high mobile phone penetration rate in many countries across the globe and availability of privacy-aware (or privacy-protective) techniques allow scientists, engineers, and planners to extract useful information from mobile phones for many applications including transportation planning. Mobile phone use data can work as rich supplementary data to traditional survey-based data commonly used in urban and transportation planning. Since 1960's, travel demand models have been developed to tackle urban transportation issues and to evaluate the impact of various planning scenarios and policies on how people travel in a city. More recently, activity- and agent-based models of travel demand, still mainly based on large and expensive survey-based data, are developed to help understand mechanisms underlying travel choices in their spatial context at the most disaggregate level possible. The next generation of travel demand models will take advantage of growing availability of mobile phone use data, GPS tracks, transactions data, and online activity patterns of individuals to predict and evaluate how people move around a city and interact with different places (people-place interaction). Mobile phone use data also provides economic value by creating a new data market for various businesses. When I first moved to Australia in 2014, I tried to establish relationships with main Australian mobile phone operators including Telstra and Optus and convince them to move toward commercialization of mobile phone use data while protecting privacy of their users. However, I was not successful (maybe with no surprise). AirSage (http://www.airsage.com/) is an example company in the US who "ANONYMOUSLY COLLECTS AND ANALYZES WIRELESS SIGNALING DATA – processing more than 15 billion mobile device locations everyday – turning them into meaningful and actionable information. As long as a mobile phone is active on the cellular network, AirSage receives wireless signals and uses them to anonymously determine location." 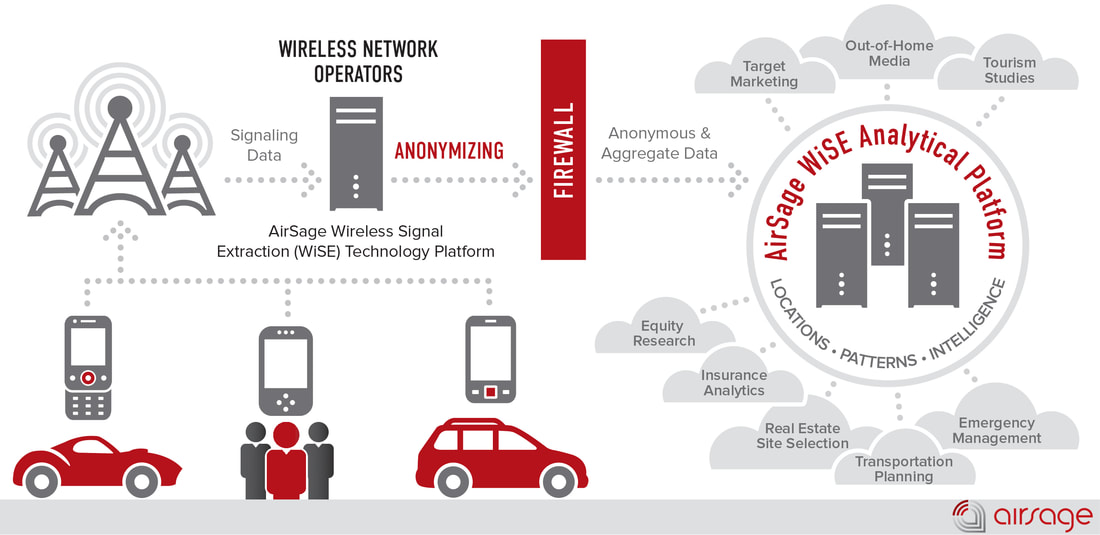 Image source: http://www.airsage.com/Technology/How-it-works/ Recently, a group of TRB committees focused on travel demand forecasting in collaboration with AirSage provided a unique opportunity to researchers to analyze multi-day travel demand in the form of origin-destination matrices gleaned from wireless signaling mobile data. The contest organizers invited short papers and supporting documents summarizing modeling or visualizations performed using the data. This was a great move towards promoting application of mobile phone use data in transportation and urban planning. Following is a visualization of origin-destination travel demand matrix in Orlando, Florida extracted from mobile phones provided by AirSage. Here, data is represented as a network (or graph) where nodes are origins and destinations and links represent trips between origin-destination pairs. Link colors represent number of trips between each origin-destination pair. Question: Now guess what the cluster of dark red links in the bottom left corner of the network represent? 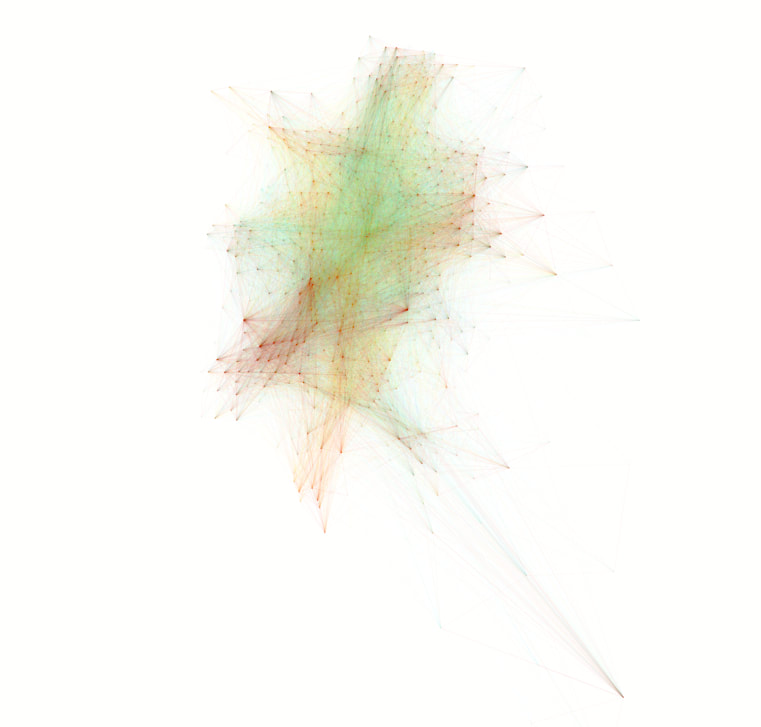 Answer: Disney World! and many other resorts, amusement and water parks are all located in this area.
If you are interested in the technical details and possible insights that one can get from analyzing such data representation, you can refer to my research laboratory website www.cityxlab.com or view some of the recent publications of Prof. Marta González from MIT (http://humnetlab.mit.edu/wordpress/) who is also an active researcher in this area. Special thanks to AirSage for providing the data as part of the TRB Data Analytics Contest and my PhD student Ziyuan Gu for analyzing and visualizing the data. Long-term transportation planning and policy making requires a proper understanding of future travel demand. Forecasting traffic growth or decline, in terms of Vehicle Kilometers Traveled (VKT), is a key element in the strategic transportation planning process. In the mid-2000s, a sudden downturn in the trend of VKT per capita, known as “peak car”, occurred for the first time in many developed countries, including Australia. Despite the growing number of studies on understanding factors influencing VKT, there has been little focus on evaluating the methodologies being used to model VKT. Applying different approaches without considering the methodological strengths and weaknesses of each approach may lead to inconsistencies in the observed patterns, proposed policies, and forecasting results. We have developed a set of models including ordinary linear least squares regression and different time-series models such as ARIMA and ARIMAX, presenting a cross-comparison of different estimation methods to model VKT. We have shown that all three types of models overestimate the VKT per capita and are unable to predict the "peak car" phenomenon. Nevertheless, based on the estimated models, fuel price plays a significant role in changes in VKT per capita in all models. Overall, the ARIMAX model outperforms other types of tested models in predicting VKT. In a what if scenario analysis, we found that if fuel price stays at $1 per litre in the coming years, the VKT per capita remains almost flat until 2020 (left figure). However, if fuel price increases and stays on average at $1.5 per litre, the VKT per capita continues to decrease at least in a short timespan (right figure). 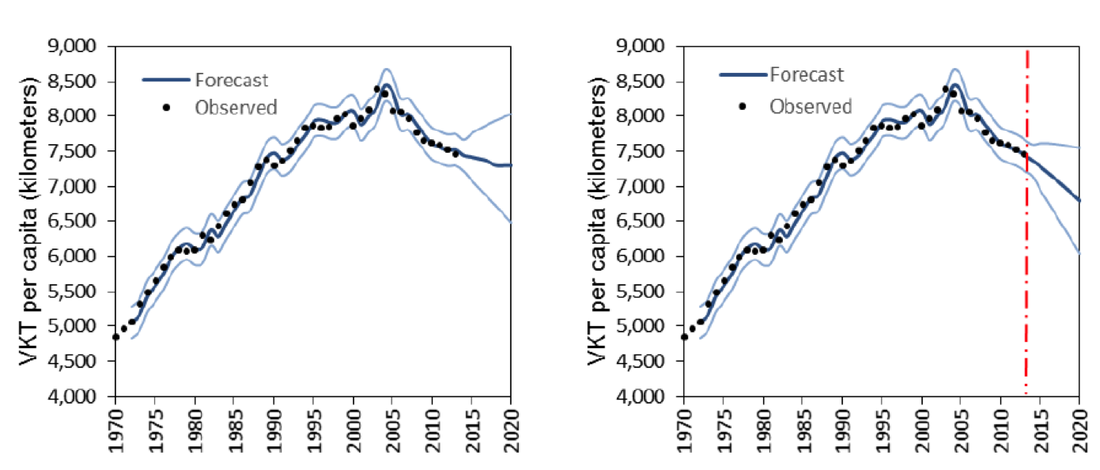 More research is still required at a less aggregated level, more local scale and with inclusion of a more comprehensive explanatory variables to provide further empirical evidence on the significant factors affecting changes in VKT trend.
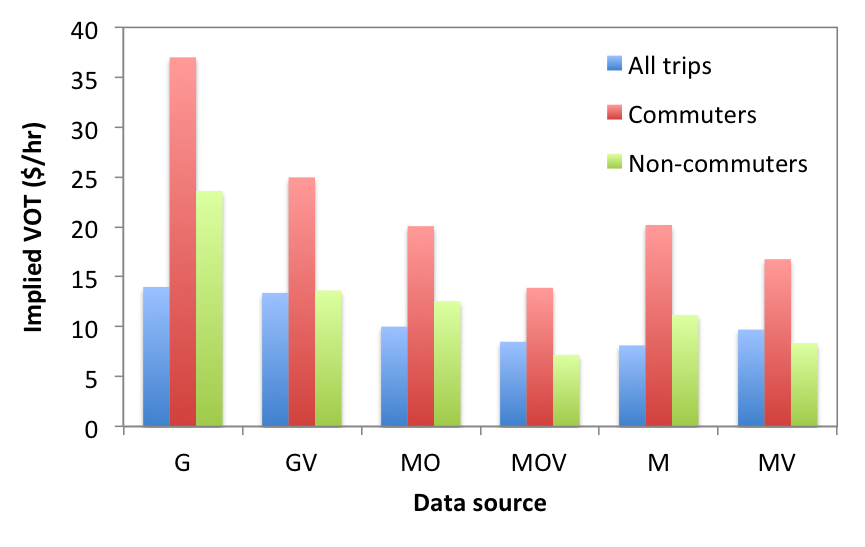
Special thanks to my PhD student Sajjad Shafiei for his great work. If you're interested to learn more about the model or apply the model to other scenarios, feel free to contact me. We welcome any collaboration with government, industry and academic partners. In a recent study in collaboration with Prof. Stephan Winter at the University of Melbourne and his PhD student Zahra Navidi, we have estimated the Value of Time (VOT) for Victorian residents. Why calculating VOT? VOT is the opportunity cost of the time that a traveller is willing to spend on his/her journey. In other terms, it's the price that a traveller is willing to pay in order to save travel time. VOT is often used in cost benefit analysis of transportation projects. It is a critical measure to evaluate the performance of many transportation policies, specifically toll projects. What's our method? There are generally two methods to estimate VOT. A straightforward approach is to ask travellers how much they are willing to pay to save let's say 1 hour of travel time. This is often done through collecting stated preference (SP) data which may suffer from less realism because it's "stated preference" and is not coming from individual's actual behaviour. An alternative approach is to estimate an "implied" VOT from revealed preference (RP) data. This is what we have done here. We have used the Victorian Integrated Survey of Travel and Activity (VISTA) to estimate different mode choice models. We then used the estimated coefficients of travel time and travel cost from the model to estimate the implied VOT. What is the VOT in Melbourne? VOT varies across individuals and highly depends on trip purpose and level of income. The average implied VOT for all trips in Melbourne is $9.71 per hour. When segmenting the market into commuters and non-commuters, we have estimated VOT of $16.77 per hour for commuters and $8.36 per hour for non-commuters. This is consistent with the numbers estimated by Prof. Hensher and Prof. Rose using SP data in a 2010 study. They estimated the VOT for commuters and non-commuters in the Australian urban context to the respective values of $22.69 and $8.01 per hour.
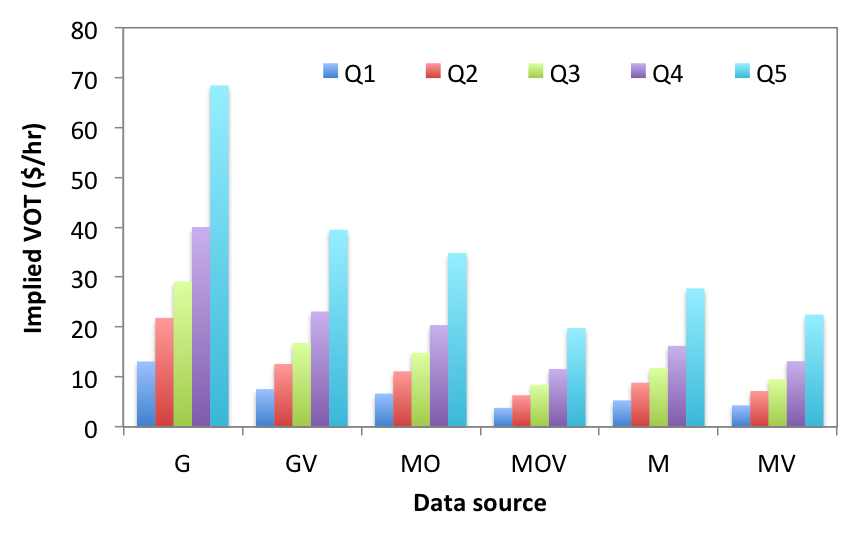
We have actually estimated a range of VOTs depending on the type of data source (Google alone, Google+VISTA, MATSIM+OTP, MATSIM+OTP+VISTA, MATSIM alone, and MATSIM+VISTA) used to estimate the attributes of the unchosen alternatives in the mode choice model.
We have also estimated VOT for different levels of income (Q1 the lowest to Q5 the highest quantile of income). Obviously, higher income is associated with higher VOT. If you are interested to learn more about our study, please contact me and I would be more than happy to send you a copy of the paper which is just submitted to the Transportation Research Board (TRB) Annual Meeting. Special thanks to Zahra Navidi for her nice work. Melbourne, while being recognized as the most livable city in the world, suffers from tremendous economic loss due to urban traffic congestion. The avoidable cost of congestion for the Australian capital cities is estimated to be $16.5 billion for the 2015 financial year, having grown from $12.8 billion in 2010. Congestion can't be entirely eliminated, to be realistic. However, we can mitigate it by various means such as better use of existing infrastructure, reducing the mismatch between supply and demand, better land use, advocating active modes, applying travel demand management strategies, implementing congestion pricing, use of advanced technologies to improve efficiency of the system, and etc. To examine any of these measures before real-world implementation, transport planners and engineers require a model of the transportation system. Currently, most of the transportation modeling work in Melbourne is done either using the 4-step MITM/VITM and ZENITH models or through more detailed microsimulation of specific sites. Both are great but have their own limitations. MITM/VITM and ZENITH are classical 4-step models based on a static traffic assignment while microsimulation, although capable of modeling detailed traffic at a fine level, can't be applied to a large-scale network and often does not consider realistic route choice. Today, Melbourne requires to take the next few big and timely steps towards use of more advanced models such as activity-based models (ABM) and dynamic traffic assignment (DTA), a unified tool for transportation planning and traffic operations. What is DTA? A Dynamic Traffic Assignment model, known as DTA, estimates the evolution and propagation of congestion through detailed models that capture travel demand, network supply and their complex interactions. Unlike a static model, a DTA model can describe time-dependent dynamics of traffic and replicate the interactions between travelers and the transportation network. DTA for Transportation Planning and Traffic Operations Travel time and cost are key components of all travel demand models throughout the entire sequence of modeling steps (4-step or activity based). Travel time and cost measures obtained from static traffic models are time-invariant. DTA models seek to provide more detailed means to represent the interaction between travel choices, traffic flows, and time and cost measures in a temporally coherent manner. DTA models aim to describe time-varying network and demand interaction using a behaviorally sound approach. Most traffic analysts rely on microscopic simulation modeling to assess the performance of transportation systems. Microscopic simulation models are not suitable for large-scale applications and do not often consider individual traveler’s route choice preference. The equilibrium-seeking DTA models are based on iterative algorithmic procedures that describes individual route choice adjustment. Mesoscopic DTA models are suitable for large-scale network applications. Static vs. Dynamic In a static model, inflow to a link is always equal to the outflow: the travel time simply increases as the inflow and outflow (volume) increases. The volume on a link may increase indefinitely and exceed the physical capacity (in vehicles per hour) of the link, as represented by a volume-to-capacity (V/C) ratio greater than 1. Since the link volume does not conform to the traffic flow limit that results from the physical characteristics of the roadway, the assigned link volume can be considered as demand— trips desired to traverse the link—instead of the actual flow. Following is an example graphic of V/C ratio in Sydney network from a study done by SGS using ZENITH to analyze the economic case for WestConnex. 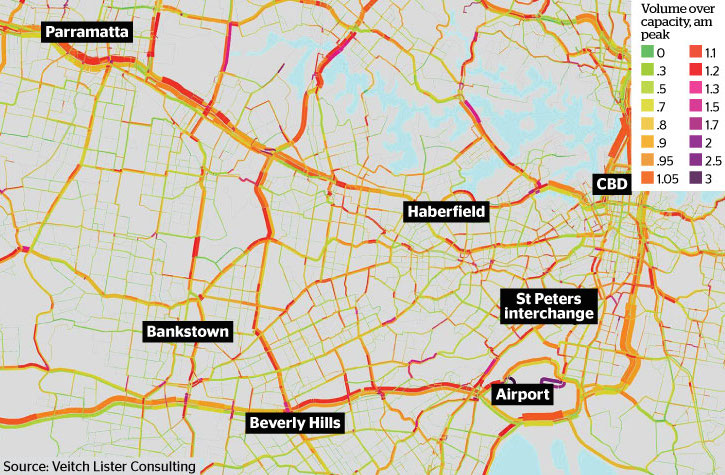 In dynamic models, as in reality, explicit modeling of traffic flow dynamics ensures direct linkage between travel time and congestion. If link outflow is lower than link inflow, link density will increase (congestion), and speed will decrease (fundamental speed–density relationship), and therefore link travel time will increase. This brings forth the issue of congestion spillback, which is not represented in a static model. A dynamic model can reproduce spillback and congestion propagation. DynaMel: A Large-Scale Mesoscopic Simulation-based DTA Model of Melbourne DynaMel is a simulation-based Dynamic Traffic Assignment (DTA) model of Melbourne. DynaMel is an analysis tool to address complex and dynamic transportation operations and planning issues of Melbourne road network. DynaMel overcomes the limitations of traditional static assignment models by using advanced traffic modeling techniques. DynaMel captures the dynamics of congestion formation and dissipation associated with time-dependent demand and network conditions. Following is a snapshot of 9:30 AM traffic patterns (assigned volumes) simulated by DynaMel. 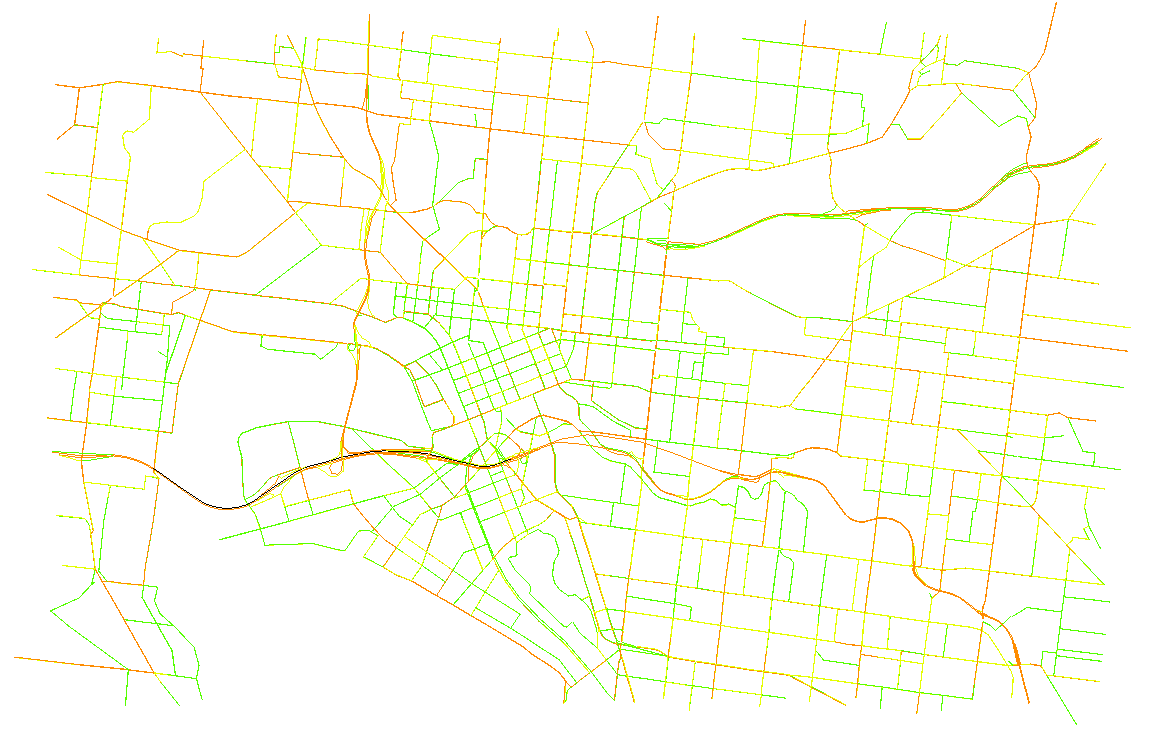 DynaMel supports transportation network planning and traffic operations decisions, overcoming many of the known limitations of static traffic models used in current planning and operations practice. DynaMel can be used to assess the impacts of ITS and non-ITS technologies on the transportation network. DynaMel can be used to support decision-making for traffic control and management. DynaMel can be used to evaluate different congestion pricing schemes, to plan for special events, and emergency situations including evacuation scenarios. To learn more about DynaMel, please visit: http://www.cityxlab.com/dynamel-dynamic-traffic-assignment-model-of-melbourne.html References
|
AuthorDr. Meead Saberi, lecturer in transportation engineering, data guru, and urban scientist Archives
August 2017
Categories |
 RSS Feed