Network science is a highly active interdisciplinary research area inspired by numerous empirical studies of computer and social networks. A system consisting of several non-identical elements connected by diverse interactions can be viewed as a complex network where the nodes are the system elements and the links are the interactions between the elements. Examples of such complex networks are the WWW, friendship networks, business relationship networks, scientific collaboration networks, virtual gaming networks, global airline and cargo ship networks, genetic interaction networks, and protein–protein interaction networks.
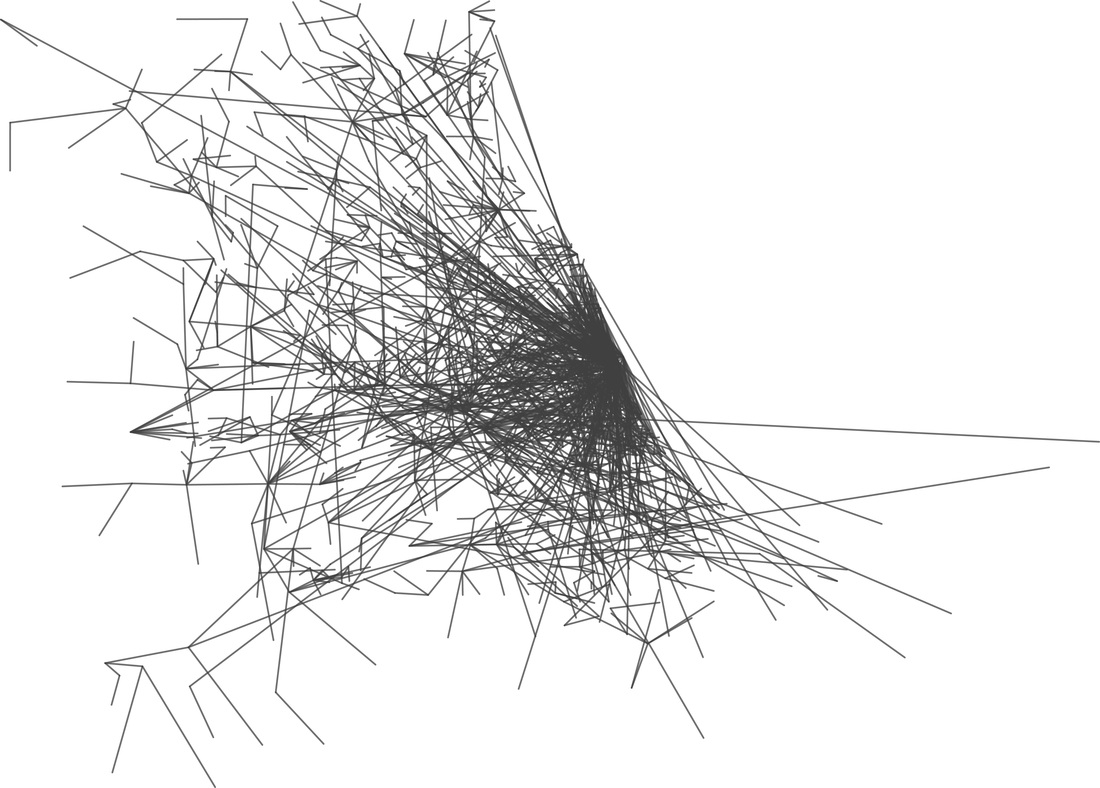
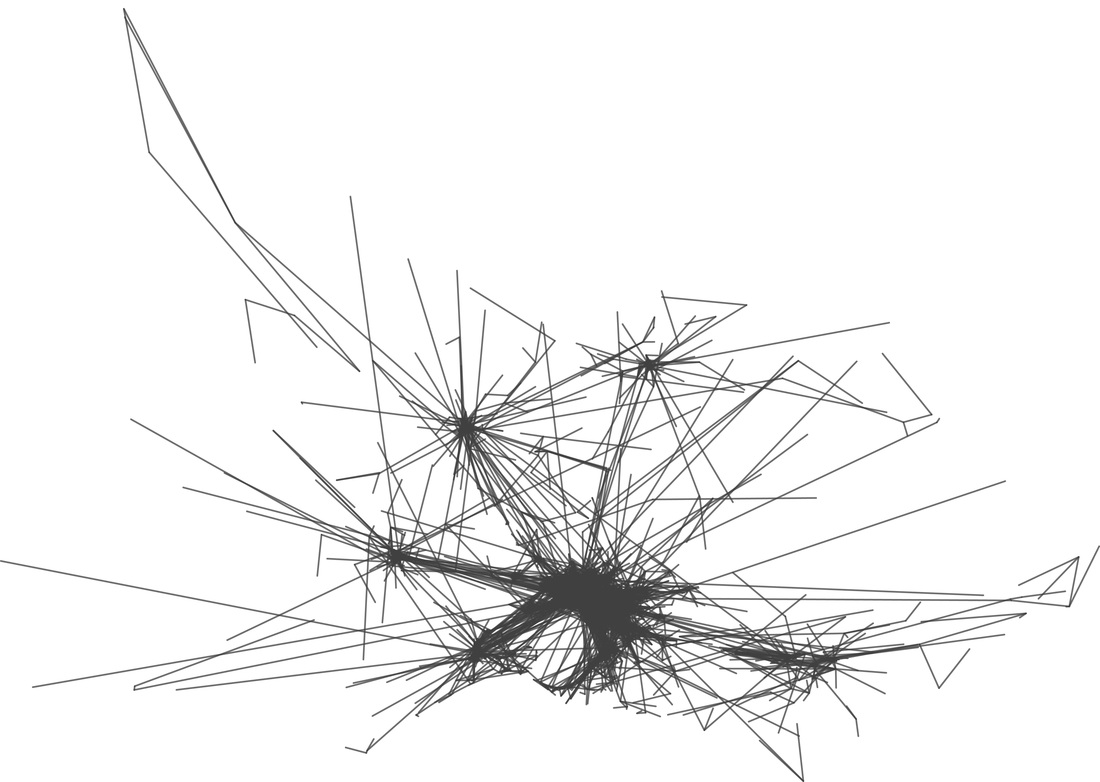
We are interested to study urban transportation systems from a complex network perspective. Transportation networks have been widely studied in the past. Advances in transportation network modeling have more focused on the supply side, mainly modeling within-day equilibria and day-to-day evolution of traffic flows leading to development of static and dynamic network traffic assignment models, and exploring dynamics of network traffic flow. Several studies have also explored the network properties of road and airline networks. We are motivated by the recognition that travel demand in cities, consisting of thousands or millions of origin–destination trips, can also be viewed as a network, more precisely a large-scale temporal weighted directed network. Figure 1 illustrates the mapped structure of travel demand (or mobility) networks in Chicago and Melbourne as examples.
|
|
Figure 1 (Left) The complex network structure of a large sample of trips in the Chicago metropolitan area, USA including 78,681 recorded trips. The mapped network has 37,528 edges and 1868 vertices. (Right) The complex network structure of a large sample of trips in the Melbourne metropolitan area, AUSTRALIA including 133,938 recorded trips. The mapped network has 63,916 edges and 9,310 vertices. [Source: Saberi et al. (2016)]
One of the main statistical properties of networks is the node degree distribution. It is shown that the degree distribution of a random network follows a Poisson distribution. Thanks to recent findings of Barabási and his team, we know that real networks are rarely random. Instead, they are often sparse with a degree distribution that follows a power law p(x) = x ^ (-beta). Scale-free networks have interesting properties. They are often robust to failure, mainly because of the hierarchical hub-and-spoke structure.
Now an interesting question is whether urban mobility networks are also scale-free? If yes, to what extent or limit? Do we see the same network properties in different types of urban mobility networks, from bike sharing to public transportation? How can we integrate classical behavioral models of travel demand with network-theoretic models of human mobility? What is the structure of communities in the urban transportation networks? and many more challenging questions.
Now an interesting question is whether urban mobility networks are also scale-free? If yes, to what extent or limit? Do we see the same network properties in different types of urban mobility networks, from bike sharing to public transportation? How can we integrate classical behavioral models of travel demand with network-theoretic models of human mobility? What is the structure of communities in the urban transportation networks? and many more challenging questions.
|

|
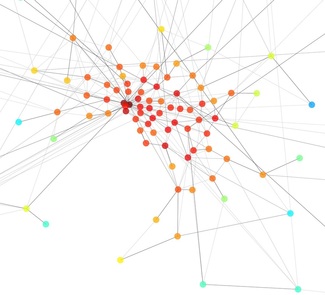
Figure 2 (left) A zoomed in view of the complex network structure of trips in Melbourne aggregated at Statistical Local Area (SLA) level. Node colors represent node degree changing from blue (low) to red (high). The network exhibit a large variation in node degree with relation to location. (right) Node degree distribution in Melbourne and Chicago mobility networks. Dashed line represent the fitted power law.
Data
We are happy to share our data for re-use for education and research purposes. When publishing results using any of our data, please cite the relevant paper listed in the table below. If you have any question, feel free to contact us.
We are happy to share our data for re-use for education and research purposes. When publishing results using any of our data, please cite the relevant paper listed in the table below. If you have any question, feel free to contact us.
The vertices file includes a list of nodes with the associated latitude and longitude.
Example: 1, 141.420135, -34.185432
Description: Node 1 is located at 141.420135 and -34.185432.
The edges file includes the number of trips represented in the 3rd column between node i (1st column) and node j (2nd column).
Example: 117,143,2
Description: There are 2 trips going from node 117 to node 143.
Publications
- Hamedmoghadam-Rafati, H., Steponavic, I., Ramezani, M., Saberi, M. (2017) A Complex Network Analysis of Macroscopic Structure of Taxi Trips. Proceedings of the 20th World Congress of the International Federation of Automatic Control (IFAC), 9-14 July, Toulouse, France.
- Saberi, M., Mahmassani, H., Brockmann, D., Hosseini, A. (2016) A Complex Network Perspective for Characterizing Urban Travel Demand Patterns: Graph Theoretical Analysis of Large-Scale Origin-Destination Demand Networks. Transportation DOI: 10.1007/s11116-016-9706-6. [pdf]
- Saberi, M., Rashidi, T.H., Ghasri, M., Ewe, K. (2016) A Network-Theoretic Methodology for Travel Demand Model Evaluation and Validation. Submitted to Networks and Spatial Economics. [under review]
- Saberi, M., Ghamami, M., Gu, Y., Shojaei, M.H., Fishman, E. (2016) Understanding the Impacts of A Public Transportation Disruption on Bike Sharing Mobility Patterns. Submitted to Networks and Spatial Economics. [under review]